Biomechanical Design and Evaluation of Meat-Hooks
By Andris Freivalds and Yong-Ku Kong, Department of Industrial and Manufacturing Engineering, The Pennsylvania State University, University Park, PA
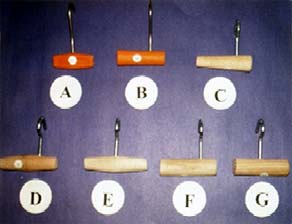
Hand and tendon force distribution is an important element in the design of hand/handle interfaces. The specific application of interest was the design of meat hooks used to control the accessibility of meat during meat processing operations. The current model is a 15 mm thick piece of flat polyethylene with a hook inserted in the middle of the piece (Hook A - see Fig. 1). Another current model uses a polyethylene frustum with the hook inserted off-center at the smaller end (Hook B). Potentially better new designs tested include Hook C, with the hook at the larger end of the frustum, Hook D, a double frustum with the hook offset and Hook E, a double frustum with the hook centered, Hook F and G, cylindrical shapes with the hook offset and with hook centered, respectively.

Figure 1: Meat Hooks
A portable hand/handle measurement system, termed the touch glove, was developed using force sensing resistors (FSRs) to measure finger forces, superimposed on a Cyber Glove (Virtual Technologies, Palo Alto, CA) to measure finger postures. Twelve FSRs were placed on the touch glove to measure the forces on the pulpy parts of each phalange. Maximum pulling forces were measured by load cell and two different force levels, 15 and 30 kg, were employed comparable to medium and maximum exerted forces as measured on-site at a meat packer. These were applied with a hanging weight, acting horizontally through a pulley mechanism, similar to an operator pulling the cow horizontally. In addition, EMG data of flexor carpii muscles were recorded using the FlexComp system (NexGen Ergonomics, Montreal, Canada) and Borg's subjective ratings of perceived exertion (RPE) were recorded for each condition.
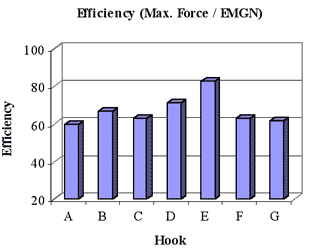
Hook E showed significantly larger maximum pulling forces (see Fig. 2) and best force efficiency when normalizing forces with EMG. The optimality of the double frustum shaped meat hook (first suggested by Bullinger, 1994) was also significantly supported by the lowest Borg RPE ratings.

Figure 2: Average Maximum Pulling Force


