Display and Analysis of the EMG Data
 The new Biometrics Analysis software comes with a comprehensive Help menu that may be used as a tutorial to use both the hardware and software for the first time.
The new Biometrics Analysis software is one of the most powerful yet cost effective EMG display and analysis software tools available. The software is purposefully NOT sold in modules but as one complete package to give the user a complete product at a price that is below most basic entry packages of other commercial products.
This is truly a cost effective high quality display and analysis software package offering the user exceptional value for money and ease of use.

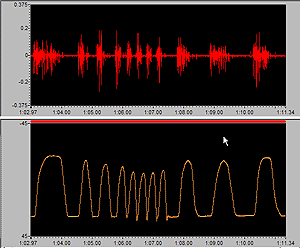
Graphs show EMG activity of the extensor muscle during active range of motion
of the MCP joint working against gravity. (Note that this trace shows the raw
EMG data collected with no filtering applied.)
Summary of Main Features
- Transfer data to memory for display, analysis and saving
- Open an unlimited number of data files with the option to track the time axis across all files allowing display and analysis for a large number of channels
- Waveform display in multiple windows and formats with full zoom, scroll and area marking facilities, option to split, tile and cascade windows
- Engineering units with custom scaling ability on all traces independently
- Each recorded file is both time and date stamped
- Independent upper and lower alarm levels both audible and visual
- File save, load and export facilities with many files simultaneously
- Graphs may be pasted into other Window applications such as Microsoft Office
- Comprehensive filtering (see below)
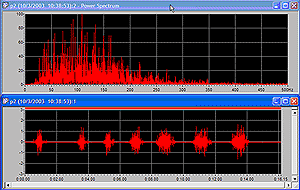
- Power Spectrum
- X-Y graphs
- Multiple traces per window
- Unlimited number of windows
- Markers - time and/or Y axis
- Paste the graph and graph key to clipboard
- Full trace management (change line width, color, background color etc.)
- Export as ASCII or Wave file
- Calculations:- minimum, maximum, mean, no. of excursions, no. of repetitions
- Filtering:
- rectify
- average
- RMS
- velocity
- integrate
- offset
- scale
- median
- mean
- median frequency
- mean frequency
- Power Spectrum Graph (linear and logarithmic)
- FFT high pass filters: remove DC, remove very low frequencies
- FFT window functions:
- Rectangle / Flat top
- Triangle / Bartlett
- Blackmann standard
- Blackmann Opt
- Hamming
- Hann

As soon as a file is opened it is displayed as a raw EMG file and may then be subject to any or all of the features listed above. The data may be left as a whole or truncated into smaller files of specific data for further analysis. Of course not only EMG data may be displayed at any one time. The Y axis may be labelled with any units governed by what sensors where connected at the time of recording, e.g. Kg or lbs for force or degrees for limb movement. These units are then saved with the file and automatically compute every time the file is reopened.

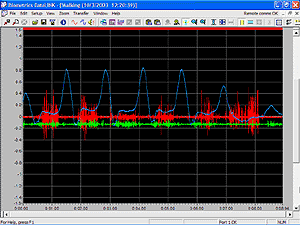
Display of right knee flexion/extension with raw unfiltered quadracep and
hamstring EMG activity of a normal subject
The digital inputs are displayed on a separate graph to the analog inputs. Using this facility toe contact and heel off may be obtained using the contact switch assembly type no. FS4.
Additional Information
Biometrics DataLINK/DataLOG EMG Sensors
Taking EMG Measurements
Hints for Analyzing EMG


